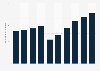
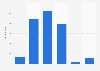
| Characteristic | Volume of vessels in million gross tonnage |
|---|---|
| - | - |
| - | - |
| - | - |
| - | - |
| - | - |
| - | - |
| - | - |
| - | - |
| - | - |
| - | - |
| - | - |
| - | - |
| - | - |
| - | - |
| - | - |
| - | - |
| - | - |
| - | - |
| - | - |
| - | - |
The chart is not accessible to screen readers. Please switch to the table view to access the data.
Download
Source
Sources
Release date
December 2022
More information
Region
Japan
Survey time period
2021
Supplementary notes
The statistic included ships of five gross tonnage or more and excluded ships that move primarily by scull or paddle.
Values have been rounded.
Citation formats