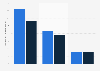
| Characteristic | Average rent in U.S. dollars per square foot |
|---|---|
| - | - |
| - | - |
| - | - |
| - | - |
| - | - |
| - | - |
| - | - |
| - | - |
| - | - |
| - | - |
| - | - |
| - | - |
| - | - |
| - | - |
| - | - |
| - | - |
The chart is not accessible to screen readers. Please switch to the table view to access the data.
Download
Source
Source
Release date
February 2021
More information
Region
Worldwide
Survey time period
2020
Supplementary notes
The source adds the following information: "We have ranked the top 20 cities for life sciences, based on their human capital, investment into health and R&D, the f low of funding into the cities, their openness for business, lifestyle indicators, and the cost of property in each market."
Citation formats