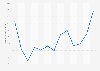
| Characteristic | Share of businesses |
|---|---|
| Mar 8 to Mar 21, 2021 | 37.3% |
| Feb 22 to Mar 7, 2021 | 40.3% |
| Feb 8 to Feb 21, 2021 | 35.4% |
| Jan 25 to Feb 7, 2021 | 35% |
| Jan 11 to 24, 2021 | 30.7% |
| Dec 29, 2020 to Jan 10, 2021 | 34.5% |
| Dec 14 to 23, 2020 | 48.5% |
| Nov 30 to Dec 13, 2020 | 47.6% |
| Nov 16 to 29, 2020 | 44.8% |
| Nov 2 to 15, 2020 | 60.1% |
| Oct 19 to Nov 1, 2020 | 60.1% |
| Oct 5 to 18, 2020 | 71.5% |
| Sep 21 to Oct 4, 2020 | 86.8% |
| Sep 7 to 20, 2020 | 73.5% |
| Aug 10 to 23, 2020 | 90.9% |
| Jul 27 to Aug 9, 2020 | 89.7% |
| Jul 13 to Jul 26, 2020 | 83.1% |
| Jun 29 to Jul 12, 2020 | 77.5% |
| Jun 15 to Jun 28, 2020 | 51.3% |
| Jun 1 to Jun 14, 2020 | 46.7% |
| May 18 to May 31, 2020 | 34.4% |
| May 4 to May 17, 2020 | 25.4% |
| Apr 20 to May 3, 2020 | 21.9% |
| Apr 6 to Apr 19, 2020 | 18.2% |
| Mar 23 to Apr 5, 2020 | 18.4% |
The chart is not accessible to screen readers. Please switch to the table view to access the data.
March 2021
United Kingdom
March 23, 2020 to March 21, 2021
1,023*
*Number of responses: March 23 to April 5: n = 516; April 6 to April 19: n = 516; April 20 to May 3: n = 556; May 4 to May 17: n = 556; May 18 to May 31: n = 651; June 1 to June 14: n = 514; June 15 to June 28: n = 480; June 29 to July 12: n = 512; July 13 to July 26: n = 472; July 27 to Aug 9: n = 515; Aug 10 to 23: n = 461; Sep 7 to 20: n = 478; Sep 21 to Oct 4: n = 525; Oct 5 to 18: n = 487; Oct 19 to Nov 1 n= 866; Nov 2 to 15: 866; Nov 16 to 29: 964; Nov 30 to Dec 13: n = 927; Dec 14 to 23: n = 808; Dec 29 to Jan 10: n = 817; Jan 11 to 24: n = 946; Jan 25 to Feb 7 n = 971; Feb 8 to 21: n = 1,006; Feb 22 to Mar 7: n = 951.
Figures for Aug 24 to Sep 6, 2020 were not provided by source.
Data can be found under Table 'Trading Status (WTD)' in the excel sheet.