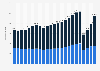
| Characteristic | Historical emissions | Post COVID-19 Current policy projection (low emissions) | Post COVID-19 Current policy projection (high emissions) | Pre-COVID-19 current policy projection (low emissions) | Pre-COVID-19 current policy projection (high emissions) |
|---|---|---|---|---|---|
| 2050 | - | 1,162 | 1,468 | 1,220 | 1,630 |
| 2049 | - | 1,009 | 1,432 | 1,196 | 1,590 |
| 2048 | - | 990 | 1,396 | 1,172 | 1,550 |
| 2047 | - | 970 | 1,360 | 1,148 | 1,510 |
| 2046 | - | 950 | 1,324 | 1,124 | 1,470 |
| 2045 | - | 910 | 1,288 | 1,100 | 1,430 |
| 2044 | - | 895 | 1,246 | 1,082 | 1,384 |
| 2043 | - | 880 | 1,205 | 1,064 | 1,338 |
| 2042 | - | 866 | 1,163 | 1,046 | 1,292 |
| 2041 | - | 851 | 1,122 | 1,028 | 1,246 |
| 2040 | - | 836 | 1,081 | 1,010 | 1,200 |
| 2039 | - | 818 | 1,054 | 988 | 1,170 |
| 2038 | - | 799 | 1,027 | 966 | 1,140 |
| 2037 | - | 781 | 999 | 944 | 1,110 |
| 2036 | - | 763 | 972 | 922 | 1,080 |
| 2035 | - | 745 | 945 | 900 | 1,050 |
| 2034 | - | 720 | 915 | 870 | 1,016 |
| 2033 | - | 695 | 884 | 840 | 982 |
| 2032 | - | 670 | 854 | 810 | 948 |
| 2031 | - | 645 | 823 | 780 | 914 |
| 2030 | - | 621 | 792 | 750 | 880 |
| 2029 | - | 609 | 762 | 736 | 846 |
| 2028 | - | 571 | 731 | 722 | 812 |
| 2027 | - | 533 | 701 | 708 | 778 |
| 2026 | - | 495 | 670 | 694 | 744 |
| 2025 | - | 457 | 639 | 680 | 710 |
| 2024 | - | 419 | 624 | 674 | 699 |
| 2023 | - | 381 | 609 | 667 | 687 |
| 2022 | - | 343 | 487 | 661 | 676 |
| 2021 | - | 305 | 365 | 654 | 664 |
| 2020 | 280 | 280 | 280 | 280 | 280 |
| 2019 | 609 | - | - | - | - |
| 2018 | 590 | - | - | - | - |
| 2017 | 585 | - | - | - | - |
| 2016 | 554 | - | - | - | - |
| 2015 | 530 | - | - | - | - |
| 2014 | 503 | - | - | - | - |
| 2013 | 486 | - | - | - | - |
| 2012 | 478 | - | - | - | - |
| 2011 | 474 | - | - | - | - |
| 2010 | 457 | - | - | - | - |
| 2009 | 433 | - | - | - | - |
| 2008 | 455 | - | - | - | - |
| 2007 | 448 | - | - | - | - |
| 2006 | 436 | - | - | - | - |
| 2005 | 420 | - | - | - | - |
| 2004 | 395 | - | - | - | - |
| 2003 | 366 | - | - | - | - |
| 2002 | 367 | - | - | - | - |
| 2001 | 347 | - | - | - | - |
| 2000 | 355 | - | - | - | - |
| 1999 | 342 | - | - | - | - |
| 1998 | 328 | - | - | - | - |
| 1997 | 317 | - | - | - | - |
| 1996 | 301 | - | - | - | - |
| 1995 | 290 | - | - | - | - |
| 1994 | 279 | - | - | - | - |
| 1993 | 264 | - | - | - | - |
| 1992 | 259 | - | - | - | - |
| 1991 | 251 | - | - | - | - |
| 1990 | 258 | - | - | - | - |
The chart is not accessible to screen readers. Please switch to the table view to access the data.
August 2021
Worldwide
1991 to 2020
* Values described here are relevant for international aviation only. It does not incorporate CO2 emissions from domestic flights.
Two scenarios were developed to evaluate the impact of COVID-19 on international aviation CO2 emissions:
The Low emission scenario assumes a 54 percent decline in international aviation emissions in 2020 compared to 2019 levels and a 60 % less demand for international aviation in 2021 compared to 2019. Low emission prediction assumes that emission levels will be back at 2019 levels by roughly 2029.
The High emission scenario assumes a 54 percent decline in international aviation in 2020 compared to 2019 and a 40 percent decrease in 2021 compared to 2019. Accordingly, aviation emissions will be back at 2019 levels by 2023.