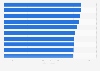
| Characteristic | Share of buses arriving regularly |
|---|---|
| - | - |
| - | - |
| - | - |
| - | - |
| - | - |
| - | - |
The chart is not accessible to screen readers. Please switch to the table view to access the data.
Download
Source
Sources
Release date
September 2019
More information
Region
France
Survey time period
2019
Supplementary notes
The source adds the following information: 鈥淭he indicator gives the percentage of vehicles for which the interval between two passages observed at the stopping point of the heaviest traffic and the theoretical interval is less than 2 minutes. "
Citation formats