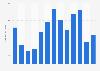
| Characteristic | EU countries | Rest of the world |
|---|---|---|
| - | - | - |
| - | - | - |
| - | - | - |
| - | - | - |
| - | - | - |
| - | - | - |
| - | - | - |
| - | - | - |
| - | - | - |
| - | - | - |
| - | - | - |
| - | - | - |
| - | - | - |
| - | - | - |
The chart is not accessible to screen readers. Please switch to the table view to access the data.
Download
Source
Sources
Release date
October 2021
More information
Region
France
Survey time period
2000 to 2020
Supplementary notes
* Provisional data
The field that delimits agri-food products is different from that defined by the French product classification, introducing differences in the results.
Data covering EU countries does not include the United Kingdom.
Citation formats