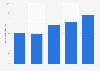
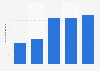
| Characteristic | Share of respondents |
|---|---|
| - | - |
| - | - |
| - | - |
| - | - |
| - | - |
The chart is not accessible to screen readers. Please switch to the table view to access the data.
Download
Source
Source
Release date
July 2020
More information
Region
India
Survey time period
as of July 2020
Number of respondents
7,599 respondents
Special properties
respondents from tier 1, tier 2 and tier 3 cities covering 270 districts.
Method of interview
Online survey
Supplementary notes
Survey question:
"In the last 3 years, when you noticed a misleading advertisement or an unfair trade practice by a brand/service provider, how did you get the issue resolved?"
Citation formats