| Characteristic | Share of respondents |
|---|---|
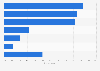
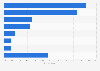
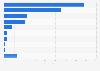
| Environmental friendliness | 46% |
| Cheaper to run (i.e., cheaper than running on fuel) | 40% |
| Save fuel resources | 39% |
| Produce less pollution / gas emissions | 37% |
| Ability to charge the vehicle at home | 37% |
| Cheaper to maintain (i.e., less service visits) | 31% |
| Are quite when driving | 28% |
| Tax benefits or cash subsidy for purchase/owning | 24% |
| Ability to charge the vehicle at place of work | 21% |
| Use renewable energy | 19% |
| Use more advanced technologies | 18% |
| Free parking offered in some parking lots | 11% |
| Additional storage space (no front engine comp.) | 11% |
| Ability to drive in public transport / express lanes | 10% |
| Have an atrractive exterior design | 8% |
| Accelerate faster than non-electric vehicles | 7% |
| Guarantee not to be affected by traffic bans | 0% |
The chart is not accessible to screen readers. Please switch to the table view to access the data.
Loading statistic...
Download
Source
Source
Release date
November 2019
More information
Region
Russia
Survey time period
November 2019
Number of respondents
106,740 respondents*
Supplementary notes
* Total number of participants across 10 participating countries (England, France, Spain, Germany, Italy, United States, Brazil, China, Japan and Russia). The source does not provide exact number of polled participants in Russia.
Citation formats