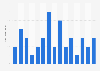
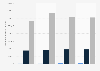
| Characteristic | Goods producing industries | Service producing industries |
|---|---|---|
| 2020 | 35.9 | 25.97 |
| 2019 | 35.6 | 24.78 |
| 2018 | 35.25 | 24.62 |
| 2017 | 34.66 | 23.52 |
| 2016 | 34.77 | 23.11 |
| 2015 | 34.93 | 23.49 |
| 2014 | 34.13 | 23.33 |
| 2013 | 34.27 | 23.16 |
| 2012 | 32.45 | 22.37 |
| 2011 | 31.26 | 22.12 |
| 2010 | 30.76 | 21.11 |
| 2009 | 29.46 | 20.87 |
| 2008 | 29.08 | 20.3 |
| 2007 | 27.3 | 19.1 |
| 2006 | 25.75 | 18.02 |
| 2005 | 24.55 | 17.13 |
| 2004 | 23.08 | 16.44 |
| 2003 | 22.77 | 15.78 |
| 2002 | 21.65 | 15.04 |
| 2001 | 21.2 | 14.93 |
The chart is not accessible to screen readers. Please switch to the table view to access the data.
Loading statistic...
Download
Source
Source
Release date
July 2021
More information
Region
Canada
Survey time period
2001 to 2020
Special properties
earnings data are based on gross payroll before source deductions
Supplementary notes
The source made this statement about the referenced industries: "Industry estimates in this table are based on the 2017 North American Industry Classification System (NAICS)" Adapted from Statistics Canada, statcan.gc.ca, 2001 to 2020. This does not constitute an endorsement by Statistics Canada of this product.
Citation formats