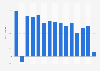
| Characteristic | Total population in thousands |
|---|---|
| 2022 | 60,605 |
| 2021 | 60,143 |
| 2020 | 59,622 |
| 2019 | 58,775 |
| 2018 | 57,458 |
| 2017 | 56,522 |
| 2016 | 55,620 |
| 2015 | 54,750 |
| 2014 | 53,912 |
| 2013 | 53,104 |
| 2012 | 52,325 |
| 2011 | 51,574 |
| 2010 | 50,850 |
| 2009 | 50,152 |
| 2008 | 49,479 |
| 2007 | 48,830 |
| 2006 | 48,205 |
| 2005 | 48,602 |
| 2004 | 47,021 |
| 2003 | 46,461 |
| 2002 | 45,921 |
The chart is not accessible to screen readers. Please switch to the table view to access the data.
Loading statistic...
Download
Source
Source
Release date
July 2022
More information
Region
South Africa
Survey time period
2002 to 2022
Supplementary notes
The figures have been taken from several publications.
Figures have been rounded.
The source mentioned that, for the period from 2002 to 2018, the data is based on mid-year population estimates produced for 2018 using the 2017 series mid-year population estimates. General Household Survey (GHS) 2017 data as well as historical data files (2002鈥�2016) were re-calibrated to this series with the release of the GHS 2017 in June 2018 in order to maintain comparability over time.
Citation formats