| Characteristic | 16-24 | 25-34 | 35-44 | 45-54 | 55 and over |
|---|---|---|---|---|---|
| - | - | - | - | - | - |
| - | - | - | - | - | - |
| - | - | - | - | - | - |
| - | - | - | - | - | - |
| - | - | - | - | - | - |
| - | - | - | - | - | - |
| - | - | - | - | - | - |
| - | - | - | - | - | - |
| - | - | - | - | - | - |
The chart is not accessible to screen readers. Please switch to the table view to access the data.
Download
Source
Source
In cooperation with
Rakuten Insight
Release date
February 2020
More information
Region
Thailand
Survey time period
December 15 to 30, 2019
Number of respondents
3,078 respondents
Age group
16 years and older
Special properties
among respondents that own a smart speaker
Method of interview
Online survey
Supplementary notes
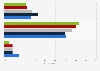
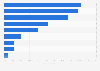
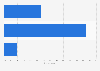
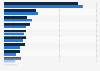
Original source question: "Which smart speaker brand do you own (only for those who own a smart speaker)?"
Values have been rounded.
There were 1,761 female and 1,317 male respondents. Other surveyed countries included China, Hong Kong, India, Indonesia, Japan, Korea, Malaysia, Philippines, Singapore, Thailand, Taiwan and Vietnam.
Citation formats