| Characteristic | Share of respondents |
|---|---|
| - | - |
| - | - |
| - | - |
| - | - |
| - | - |
| - | - |
| - | - |
The chart is not accessible to screen readers. Please switch to the table view to access the data.
Download
Source
Sources
Release date
October 2019
More information
Region
Russia
Survey time period
September 2019
Number of respondents
1,729 respondents
Age group
18 years and older
Special properties
Taxi users*
Supplementary notes
* Respondents using taxi services at least several times a year were polled in cities with ten thousand inhabitants and above.
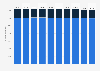
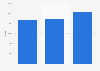
Participants were allowed to choose several answers. The statistic represents answers named by at least one percent of respondents.
Citation formats