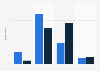


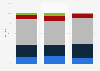

| Characteristic | Decrease by >10% | Decrease by 3-10% | Increase by 3-10% | Increase by >10% | Little or no change* |
|---|---|---|---|---|---|
| - | - | - | - | - | - |
| - | - | - | - | - | - |
| - | - | - | - | - | - |
| - | - | - | - | - | - |
| - | - | - | - | - | - |
| - | - | - | - | - | - |
| - | - | - | - | - | - |
| - | - | - | - | - | - |
| - | - | - | - | - | - |
| - | - | - | - | - | - |
| - | - | - | - | - | - |
| - | - | - | - | - | - |
The chart is not accessible to screen readers. Please switch to the table view to access the data.
Download
Source
Source
In cooperation with
McKinsey & Company
Release date
November 2019
More information
Region
Worldwide
Survey time period
March 26 to April 5, 2019
Number of respondents
1,872 respondents
Method of interview
Online survey
Supplementary notes
*Little or no change refers to a decrease or increase in the workforce of less than or equal to 2%.
Citation formats





