
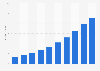


| Characteristic | Share of respondents |
|---|---|
| Full stack developer | 25% |
| Backend developer | 19% |
| Quality engineer | 9% |
| Frontend developer | 5% |
| Technical/solutions architect | 4% |
| Director/Manager | 4% |
| Integration engineer | 3% |
| DevOps engineer | 3% |
| Student/professor | 3% |
| Data engineer/analyst | 3% |
| Product manager | 3% |
| CTO | 2% |
| Business analyst | 2% |
| Mobile developer | 2% |
| Support / customer success | 2% |
| CEO | 1% |
| Sales/solutions engineer | 1% |
| Network engineer | 1% |
| Security engineer | 1% |
| VP of engineering | 1% |
| Other | 5% |
The chart is not accessible to screen readers. Please switch to the table view to access the data.
Loading statistic...
Download
Source
Source
Release date
August 2022
More information
Region
Worldwide
Survey time period
June and July 2022
Number of respondents
37,332 respondents
Special properties
developers, testers, and executives
Supplementary notes
Due to rounding, percentages may not add up to 100 percent.
Citation formats



