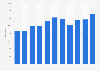
| Characteristic | Stock in million animals |
|---|---|
| - | - |
| - | - |
| - | - |
| - | - |
| - | - |
| - | - |
| - | - |
| - | - |
| - | - |
| - | - |
| - | - |
| - | - |
| - | - |
| - | - |
| - | - |
| - | - |
| - | - |
| - | - |
| - | - |
| - | - |
| - | - |
| - | - |
| - | - |
| - | - |
| - | - |
| - | - |
| - | - |
The chart is not accessible to screen readers. Please switch to the table view to access the data.
Download
Source
Sources
Release date
January 2025
More information
Region
Germany
Survey time period
1900 to 2024
Special properties
As of November each year
Supplementary notes
* Preliminary figure.
Regarding figures from 1900, the source refers to the Reich area of 1930. For the time frame until 1990 numbers from the former Federal territory were added to those from the former GDR.
Pig stock is evaluated every half-year, reporting dates are May 3 and November 3. To access this statistic, click the web link and type the code "41311-0001" into the search bar.
Citation formats