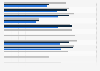
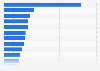
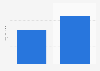
| Characteristic | Average number of treatments |
|---|---|
| - | - |
| - | - |
| - | - |
| - | - |
| - | - |
| - | - |
| - | - |
| - | - |
The chart is not accessible to screen readers. Please switch to the table view to access the data.
Download
Source
Source
Release date
July 2015
More information
Region
France
Survey time period
2013
Supplementary notes
* Treatment used to cure or prevent diseases of plant organisms. These products are pesticides and include insecticides, fungicides, herbicides and bactericides.
The source adds the following information: "the confidence interval measures the range of values within which the "true" value is 95% likely to be, In 2013, the average number of treatments on tomato has a 95% chance to be between 11.91 (12.1 - 0.19) and 12, 29 (12.1 + 0.19).
Half-confidence intervals:
- tomato: 0,19
- carrot: 0,06
- leek: 0,17
- melon: 0,06
- strawberry: 0,36
- other sprouts: 0,11
- salad: 0,03
- cauliflower: 0,02 禄
Citation formats