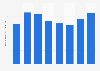
| Characteristic | PMI |
|---|---|
| Oct '25 | 48 |
| Sep '25 | 46.6 |
| Aug '25 | 45.9 |
| Jul '25 | 44.8 |
| Jun '25 | 47.1 |
| May '25 | 50.2 |
| Apr '25 | 50.7 |
| Mar '25 | 50.6 |
| Feb '25 | 48.8 |
| Jan '25 | 48.2 |
| Dec '24 | 48.9 |
| Nov '24 | 49.2 |
| Oct '24 | 48.6 |
| Sep '24 | 47.8 |
| Aug '24 | 47.3 |
| Jul '24 | 45 |
| Jun '24 | 45 |
| May '24 | 45.9 |
| Apr '24 | 48 |
| Mar '24 | 47.9 |
| Feb '24 | 47.1 |
| Jan '24 | 47.4 |
| Dec '23 | 48.7 |
| Nov '23 | 44.5 |
| Oct '23 | 43.9 |
| Sep '23 | 43.1 |
| Aug '23 | 43.5 |
| Jul '23 | 45.1 |
| Jun '23 | 47 |
| May '23 | 46.6 |
| Apr '23 | 48.3 |
| Mar '23 | 48.5 |
| Feb '23 | 47.5 |
| Jan '23 | 45.6 |
| Dec '22 | 43.4 |
| Nov '22 | 42 |
| Oct '22 | 43 |
| Sep '22 | 40.9 |
| Aug '22 | 42.1 |
| Jul '22 | 44.4 |
| Jun '22 | 48.5 |
| May '22 | 52.4 |
| Apr '22 | 52.7 |
| Mar '22 | 54.7 |
| Feb '22 | 54.4 |
| Jan '22 | 56.1 |
| Dec '21 | 54.4 |
| Nov '21 | 53.8 |
| Oct '21 | 53.4 |
| Sep '21 | 56 |
| Aug '21 | 57.6 |
| Jul '21 | 59.4 |
| Jun '21 | 57.2 |
| May '21 | 53.7 |
| Apr '21 | 54.3 |
| Mar '21 | 53.4 |
| Feb '21 | 51.9 |
| Jan '21 | 51.7 |
| Dec '20 | 50.8 |
| Nov '20 | 50.8 |
| Oct '20 | 50.8 |
| Sep '20 | 50.6 |
| Aug '20 | 52.8 |
| Jul '20 | 47.2 |
| Jun '20 | 40.6 |
| May '20 | 31.9 |
| Apr '20 | 42.4 |
| Mar '20 | 48.2 |
| Feb '20 | 47.4 |
| Jan '20 | 48 |
| Dec '19 | 46.7 |
| Nov '19 | 45.6 |
| Oct '19 | 47.8 |
| Sep '19 | 48.8 |
| Aug '19 | 47.4 |
| Jul '19 | 48.4 |
| Jun '19 | 48.8 |
| May '19 | 49 |
| Apr '19 | 48.7 |
| Mar '19 | 47.6 |
| Feb '19 | 48.2 |
| Jan '19 | 47.6 |
| Dec '18 | 49.5 |
| Nov '18 | 50.4 |
| Oct '18 | 50.5 |
| Sep '18 | 51.4 |
| Aug '18 | 52.9 |
| Jul '18 | 54.2 |
| Jun '18 | 53.3 |
| May '18 | 53.9 |
| Apr '18 | 53.7 |
| Mar '18 | 53.7 |
| Feb '18 | 54.6 |
| Jan '18 | 55 |
The chart is not accessible to screen readers. Please switch to the table view to access the data.
October 2025
Poland
January 2018 to October 2025
According to the source, "Purchasing managers are asked a series of questions that measure whether business conditions have improved, deteriorated, or remained unchanged from the previous month. Results are calculated as diffusion indices. These are calculated as the percentage of respondents indicating an improvement, plus half the percentage of respondents indicating no change. Diffusion indices differ from percentage balances in that they do not effectively exclude the findings of those who reported no change. An index reading of 100 indicates that all respondents expect an increase, and a score of zero indicates that all respondents expect a decrease. A score of 50 shows that informants are either equally divided between those expecting an increase and those expecting a decrease or that all respondents report no change in activity in comparison with the previous month."
The PMI is a weighted average of the following five indices: New Orders (30%), Output (25%), Employment (20%), Suppliers鈥� Delivery Times (15%), and Stocks of Purchases (10%). For the PMI calculation, the Suppliers鈥� Delivery Times Index is inverted so that it moves in a comparable direction to the other indices.