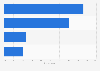
| Characteristic | Share of respondents |
|---|---|
| - | - |
| - | - |
| - | - |
| - | - |
| - | - |
| - | - |
| - | - |
| - | - |
| - | - |
| - | - |
| - | - |
| - | - |
| - | - |
| - | - |
| - | - |
| - | - |
| - | - |
| - | - |
| - | - |
| - | - |
The chart is not accessible to screen readers. Please switch to the table view to access the data.
Download
Source
Source
Release date
August 2016
More information
Region
Denmark
Survey time period
April 2016
Number of respondents
1,059 respondents
Age group
18-65 years
Special properties
refers to employees and students
Method of interview
Online survey
Supplementary notes
The original question was phrased by the source as follows: "Hvis du selv skulle sammens忙tte din ideelle kantine, hvilke af nedenst氓ende ville din ideelle kantine s氓 prioritere s忙rligt h酶jt?"
Citation formats