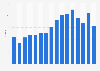
| Characteristic | Comparable sales change |
|---|---|
| 2023 | -9% |
| 2022 | 4.4% |
| 2021 | 51.6% |
| 2020 | -34.2% |
| 2019 | 0.8% |
| 2018 | 6.1% |
| 2017 | -0.4% |
| 2016 | -3% |
| 2015 | 0.8% |
| 2014 | 1.8% |
| 2013 | 0.2% |
The chart is not accessible to screen readers. Please switch to the table view to access the data.
Loading statistic...
Download
Source
Source
Release date
March 2024
More information
Region
Worldwide
Survey time period
2013 to 2023*
Supplementary notes
A DSW or ABG store is considered comparable when in operation for at least 14 months at the beginning of the fiscal year. Stores are added to the comparable base at the beginning of the year and are dropped for comparative purposes in the quarter they are closed. Comparable sales includes sales from dsw.com and excludes sales from Gordmans and Ebuys. The calculation of comparable sales varies across the retail industry and, as a result, the calculations of other retail companies may not be consistent with our calculation.
* Fiscal year 2023 ended on February 4, 2024.聽
Fiscal year 2017 was a 53-week year. All other fiscal years are based on a 52-week year.
Citation formats