



T. Ozbun
Research expert covering food retail and all food topics for Italy and Brazil
Get in touch with us nowThe chart is not accessible to screen readers. Please switch to the table view to access the data.
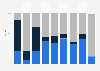
This statistic depicts the share of dollar sales of groceries in the United States from 1988 to 2018, broken down by sales channel. In 2018, only ** percent of groceries were sold in traditional grocery stores, compared to ** percent in 1988.
Log in or register to access precise data.
* For commercial use only
Basic Account
Starter Account
The statistic on this page is a Premium Statistic and is included in this account.
Professional Account
1 All prices do not include sales tax. The account requires an annual contract and will renew after one year to the regular list price.
About the industry
About the region
Selected statistics
Other regions
Related statistics
* For commercial use only
Basic Account
Starter Account
The statistic on this page is a Premium Statistic and is included in this account.
Professional Account
1 All prices do not include sales tax. The account requires an annual contract and will renew after one year to the regular list price.



