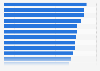
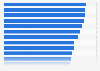
| Characteristic | Share of respondents |
|---|---|
| - | - |
| - | - |
| - | - |
The chart is not accessible to screen readers. Please switch to the table view to access the data.
Download
Source
Sources
Release date
January 2018
More information
Region
North America
Survey time period
October 2017
Number of respondents
1,000 respondents
Age group
13-17 years
Special properties
active teen mobile gamers that played mobile games within the last three months on a smartphone or tablet
Supplementary notes
Non-payer spends zero U.S. dollars annually.
Moderate payer spends between 0.99-100 U.S. dollars annually.
Heavy payer spends over 100 U.S. dollars annually.
Citation formats