



Download
Source
Source
Release date
June 2018
More information
Region
Europe
Survey time period
2012 to 2017
Supplementary notes
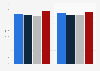
* Figures of 100 million or more were rounded to billions by the source. Here they have been converted back to millions for ease of comparison with lower figures (i.e. 0.1 billion - 100 million).
Citation formats



