| Characteristic | 2008 | 2018 |
|---|---|---|
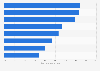
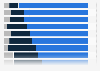
| Hungary | 43.7% | 65.09% |
| Greece | 17% | 54.6% |
| Poland | 32.1% | 51.18% |
| Italy | 8.3% | 50.03% |
| Czechia | 12.81% | 49.6% |
| Cyprus | 31.1% | 35.38% |
| Slovakia | 11.7% | 34.34% |
| Estonia | 26.1% | 32.9% |
| Lithuania | 29.04% | 32.83% |
| Bulgaria | 26% | 32.65% |
| France | 13.82% | 27.09% |
| Austria | 28.24% | 26% |
| Finland | 12.9% | 24.78% |
| Netherlands | 22.49% | 22.2% |
| Germany | 10.3% | 21.98% |
| Spain | 3.77% | 21.15% |
| Denmark | 13.9% | 21.1% |
| Sweden | 8.78% | 18.58% |
| Ireland | 8.03% | 17.7% |
| Romania | 3.15% | 9.98% |
| Portugal | 8.34% | 9.38% |
| Slovenia | 5.4% | 8.2% |
| Latvia | 7% | 6.85% |
| Croatia | 1.8% | 6.49% |
| Luxembourg | 1.9% | 4.94% |
| Belgium | 16.02% | 4.09% |
| United Kingdom | 2.2% | 1.8% |
The chart is not accessible to screen readers. Please switch to the table view to access the data.
Loading statistic...
Download
Source
Source
Release date
March 2018
More information
Region
EU
Survey time period
2018
Supplementary notes
The source adds the following information: "How did Euronews decide what was a populist party? We used a classification developed by the University of Melbourne. It ranked parties on the extent to which they: opposed the political class, financial institutions, immigrants or ethnic minorities; depended on the personality of a leader; and violated liberal democratic norms."
Citation formats