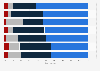
| Characteristic | Number of people affected in millions |
|---|---|
| - | - |
| - | - |
| - | - |
| - | - |
| - | - |
| - | - |
| - | - |
| - | - |
| - | - |
The chart is not accessible to screen readers. Please switch to the table view to access the data.
Download
Source
Source
Release date
September 2020
More information
Region
United States
Survey time period
as of 2020
Supplementary notes
Performance benchmarks set at the level achieved by the top-performing state with available data for this indicator.
* Estimate based on working-age population ages 18鈥�64 with employer-sponsored insurance and Medicare beneficiaries age 65 and older.
Citation formats