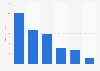
| Characteristic | Ranking among 30 countries |
|---|---|
| - | - |
| - | - |
| - | - |
| - | - |
| - | - |
The chart is not accessible to screen readers. Please switch to the table view to access the data.
October 2019
China
2015 to 2019
7,200 to 12,500
*In the Soft Power 30 study, the economic soft power assets are measured in the category named Enterprise. It is not a measure of economic power or output, but rather an aim to capture the relative attractiveness of a country's economic model in terms of its competitiveness, capacity for innovation, and ability to foster enterprise and commerce.
The Soft Power 30 study is conducted annually since 2015. It assesses the soft power resources of 30 countries combining objective and subjective data.
Objective data is structured into six categories: government; culture; global engagement; education; digital; and enterprise.
Subjective data is based on a public opinion polling in 20-25 countries across the world's major regions. In 2015, polling took place in 20 countries, whereas since 2016 it was expanded to 25 countries. The sample size was increased from 7,200 to 10,500 to 11,000 to 12,500 respectively. The samples within each country were representative by age, gender, and region.