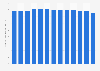
| Characteristic | CPI Score* |
|---|---|
| - | - |
| - | - |
| - | - |
| - | - |
| - | - |
| - | - |
| - | - |
| - | - |
| - | - |
| - | - |
| - | - |
| - | - |
The chart is not accessible to screen readers. Please switch to the table view to access the data.
Download
Source
Source
Release date
February 2024
More information
Region
Spain
Survey time period
2012 to 2023
Supplementary notes
* The CPI 2017 is calculated using 13 different data sources from 12 different institutions that capture perceptions of corruption within the past two years. A score of 0 indicates high perceptions of corruption and a score of 100 indicates that no corruption is perceived in the respective country.
Citation formats