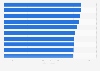
| Characteristic | Note on a scale from 0 to 10 |
|---|---|
| - | - |
| - | - |
| - | - |
| - | - |
| - | - |
The chart is not accessible to screen readers. Please switch to the table view to access the data.
Download
Source
Source
Release date
January 2018
More information
Region
Italy
Survey time period
January 26, 2018
Number of respondents
800 respondents
Age group
18 years and older
Method of interview
Computer-assisted telephone interviews (CATI)
Supplementary notes
Mixed CATI and CAWI methodology.
This question was phrased by the source as follows: "Utilizzando un voto scolastico da 1 a 10 (dove 1 猫 il minimo e 10 猫 il massimo), che voto darebbe al trasporto pubblico locale della Sua citt脿 e della Sua regione?" .
Citation formats