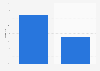
| Characteristic | Year-over-year sales growth |
|---|---|
| - | - |
| - | - |
| - | - |
| - | - |
| - | - |
| - | - |
| - | - |
| - | - |
| - | - |
| - | - |
| - | - |
| - | - |
| - | - |
| - | - |
| - | - |
| - | - |
The chart is not accessible to screen readers. Please switch to the table view to access the data.
Download
Source
Source
Release date
May 2020
More information
Region
United States
Survey time period
2005 to 2020
Supplementary notes
* No data available.
**From 2018 onwards, the source changed the sales change figure from an annual figure to a monthly year-over-change. From 2018 onwards, y-o-y-sales in the month April, the most popular month for bbq sales, are given.
Citation formats