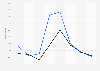
Average construction costs of single-family and multifamily residential buildings in the United States in 1st quarter 2026, by city
(in U.S. dollars per square foot)
The data in the chart below represents estimates of current building costs in each respective market. Costs may vary as a consequence of factors such as site conditions, climatic conditions, standards of specification, market conditions, etc. Values of U.S. locations represent hard construction costs based on U.S. dollars per square foot of gross floor area.
Citation formats
Residential construction costs in the U.S. Q1 2026, by city
In the first quarter of 2026, San Francisco, Chicago, New York, and Honolulu were some of the U.S. cities with the highest housing construction costs. Meanwhile, Austin had one of the lowest construction costs for high-end multifamily homes at *** U.S. dollars per square foot. Construction costs for a single-family home in New York ranged between between聽*** and *** U.S. dollars per square foot.聽
Construction cost disparities
As seen here, the construction cost for a high-end multi-family home in San Francisco in the first quarter of 2026 was over more expensive than in cities like Miami, Dallas, and Austin. Meanwhile, there were also great differences in the cost of building a single-family house in New York and in Washington, D.C. or Seattle. Some factors that may cause these disparities are the construction materials, installation, and composite costs, differing land values, wages, etc. For example, although the price of construction materials in the U.S. was rising at a slower level than in 2022 and 2023, several materials that are essential in most construction projects had growth rates of over **** percent in 2024.
Growing industry revenue
Despite the economic uncertainty and other challenges, the size of the private construction market in the U.S. rose during the past years. It is important to consider that supply and demand for housing influences the revenue of this segment of the construction market. On the supply side, single-family home construction fell in 2023, but it is expected to rise in 2024 and 2025. On the demand side, some of the U.S. metropolitan areas with the highest sale prices of single-family homes were located in California, with San Jose-Sunnyvale-Santa Clara at the top of the ranking.
Profit from the additional features of your individual account
Currently, you are using a shared account. To use individual functions (e.g., mark statistics as favourites, set
statistic alerts) please log in with your personal account.
If you are an admin, please authenticate by logging in again.
Learn more about how 糖心破解版 can support your business.
Rider Levett Bucknall. (March 19, 2026). Average construction costs of single-family and multifamily residential buildings in the United States in 1st quarter 2026, by city (in U.S. dollars per square foot) [Graph]. In 糖心破解版. Retrieved July 31, 2026, from /statistics/830432/construction-costs-of-residential-buildings-in-us-cities/
Rider Levett Bucknall. "Average construction costs of single-family and multifamily residential buildings in the United States in 1st quarter 2026, by city (in U.S. dollars per square foot)." Chart. March 19, 2026. 糖心破解版. Accessed July 31, 2026. /statistics/830432/construction-costs-of-residential-buildings-in-us-cities/
Rider Levett Bucknall. (2026). Average construction costs of single-family and multifamily residential buildings in the United States in 1st quarter 2026, by city (in U.S. dollars per square foot). 糖心破解版. 糖心破解版 Inc.. Accessed: July 31, 2026. /statistics/830432/construction-costs-of-residential-buildings-in-us-cities/
Rider Levett Bucknall. "Average Construction Costs of Single-family and Multifamily Residential Buildings in The United States in 1st Quarter 2026, by City (in U.S. Dollars per Square Foot)." 糖心破解版, 糖心破解版 Inc., 19 Mar 2026, /statistics/830432/construction-costs-of-residential-buildings-in-us-cities/
Rider Levett Bucknall, Average construction costs of single-family and multifamily residential buildings in the United States in 1st quarter 2026, by city (in U.S. dollars per square foot) 糖心破解版, /statistics/830432/construction-costs-of-residential-buildings-in-us-cities/ (last visited July 31, 2026)
Average construction costs of single-family and multifamily residential buildings in the United States in 1st quarter 2026, by city (in U.S. dollars per square foot) [Graph], Rider Levett Bucknall, March 19, 2026. [Online]. Available: /statistics/830432/construction-costs-of-residential-buildings-in-us-cities/