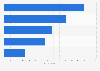
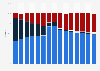
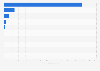
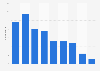
| Characteristic | Share of respondents |
|---|---|
| - | - |
| - | - |
| - | - |
| - | - |
| - | - |
| - | - |
| - | - |
| - | - |
The chart is not accessible to screen readers. Please switch to the table view to access the data.
Download
Source
Source
Release date
January 2018
More information
Region
Japan
Survey time period
September to October 2017
Number of respondents
500 respondents
Age group
20 years and older
Method of interview
Online survey
Supplementary notes
Research subjects were 2,000 men and women in Japan, US and Europe, who have their drivers鈥� license for more than a year and drive a car twice a week or more.
Citation formats