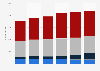
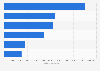
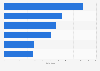
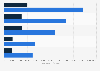
| Characteristic | Number of transplants |
|---|---|
| - | - |
| - | - |
| - | - |
| - | - |
| - | - |
| - | - |
| - | - |
| - | - |
| - | - |
| - | - |
| - | - |
| - | - |
| - | - |
| - | - |
The chart is not accessible to screen readers. Please switch to the table view to access the data.
Download
Source
Source
Release date
September 2017
More information
Region
United States
Survey time period
2010 to 2016
Supplementary notes
Numbers represent the number of units shipped for transplant patients within a given condition. Categories of HSC source are mutually exclusive; see the Health Resources and Services Administration (HRSA) documentation for more details on disease categories.
Citation formats