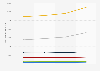
| Characteristic | Electricity demand in gigawatt hours |
|---|---|
| - | - |
| - | - |
| - | - |
| - | - |
| - | - |
| - | - |
| - | - |
| - | - |
The chart is not accessible to screen readers. Please switch to the table view to access the data.
January 2019
Italy
2018
*The source adds the following information: 鈥淭he regions are combined in the clusters that follows based on production and consumption. Turin: Piedmont, Liguria, Aosta Valley; Milan: Lombardy; Venice: Friuli-Venezia Giulia, Greater Venice, Trentino-South Tyrol; Florence: Emilia-Romagna, Tuscany; Rome: Lazio, Umbria, Abruzzo, Molise, Marche; Naples: Campania, Apulia, Basilicata, Calabria; Palermo: Sicily; Cagliari: Sardinia. In Lombardy and Emilia-Romagna, the geographical borders do not correspond to the electrical borders. Lombardy includes production plants that are part of the geographical-administrative territory of Emilia-Romagna鈥�.