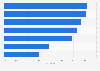
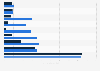
| Characteristic | Pedestrian share |
|---|---|
| - | - |
| - | - |
| - | - |
| - | - |
| - | - |
The chart is not accessible to screen readers. Please switch to the table view to access the data.
Download
Source
Source
Release date
April 2016
More information
Region
Belgium, France, Germany, Italy, Netherlands, Sweden
Survey time period
2016
Number of respondents
13,822 respondents
Special properties
pedestrians aged 25 to 35; the number of persons observed does not correspond to the total sample
Supplementary notes
Data collection method: Interviewers were stationed at three locations in the city centre (major intersections, public transport stations and stations), where pedestrian density is highest, and observed and documented pedestrian behaviour (in Amsterdam, Berlin, Brussels, Paris, Rome and Stockholm).
Citation formats