| Characteristic | Q2 2017 | Q4 2018 | Q3 2019 | Q4 2020 | Q4 2021 |
|---|---|---|---|---|---|
| - | - | - | - | - | - |
| - | - | - | - | - | - |
| - | - | - | - | - | - |
| - | - | - | - | - | - |
| - | - | - | - | - | - |
| - | - | - | - | - | - |
| - | - | - | - | - | - |
| - | - | - | - | - | - |
| - | - | - | - | - | - |
| - | - | - | - | - | - |
| - | - | - | - | - | - |
| - | - | - | - | - | - |
| - | - | - | - | - | - |
The chart is not accessible to screen readers. Please switch to the table view to access the data.
Download
Source
Source
Release date
February 2022
More information
Region
United States
Survey time period
Q2 2017 to Q4 2021
Number of respondents
7,000*
Method of interview
Online survey
Supplementary notes
* refers to U.S., UK, Germany and Nordics, as well as only to the survey period of 2021.
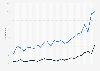
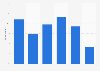
The figures represent the streaming services that are used by the ones who have used a streaming or download service to watch TV, series or movies within the last week.
Citation formats