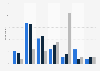
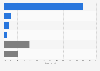
| Characteristic | Cost difference rate |
|---|---|
| - | - |
| - | - |
| - | - |
| - | - |
| - | - |
| - | - |
| - | - |
| - | - |
| - | - |
| - | - |
| - | - |
| - | - |
| - | - |
| - | - |
| - | - |
| - | - |
| - | - |
| - | - |
| - | - |
| - | - |
| - | - |
| - | - |
| - | - |
| - | - |
| - | - |
| - | - |
| - | - |
| - | - |
| - | - |
| - | - |
| - | - |
| - | - |
| - | - |
| - | - |
| - | - |
| - | - |
| - | - |
| - | - |
| - | - |
| - | - |
| - | - |
| - | - |
| - | - |
| - | - |
| - | - |
| - | - |
| - | - |
| - | - |
| - | - |
| - | - |
| - | - |
The chart is not accessible to screen readers. Please switch to the table view to access the data.
Download
Source
Sources
Release date
March 2017
More information
Region
United States
Survey time period
2015
Supplementary notes
The source adds the following information: "NerdWallet analyzed one year of data from the U.S. Census Bureau鈥檚 American Community Survey from 2015, the most-recent data available. To determine the homeownership premium, we used the median gross rent for all rental properties and the median homeownership cost for all states and Washington, D.C., to determine a percentage that shows the added cost, as a premium, that people pay each month to own a home."
Citation formats