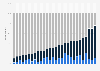
| Characteristic | Share of respondents |
|---|---|
| - | - |
| - | - |
| - | - |
| - | - |
| - | - |
| - | - |
| - | - |
| - | - |
| - | - |
| - | - |
| - | - |
| - | - |
| - | - |
The chart is not accessible to screen readers. Please switch to the table view to access the data.
Download
Source
Source
Release date
May 2018
More information
Region
India
Survey time period
February to March 2018
Special properties
across rural and urban areas in 13 states with a sample of 160 households from at least 2 districts in each state
Method of interview
Face-to-face interviews, telephone interviews
Supplementary notes
Original title in the source: Households experienced corruption in public services.
*Basis for calculating experienced corruption was those who interacted with at least one public service during the year preceding the survey.
Citation formats