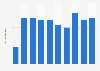
| Characteristic | Number of ground subsidence cases |
|---|---|
| - | - |
| - | - |
| - | - |
| - | - |
| - | - |
| - | - |
| - | - |
| - | - |
| - | - |
| - | - |
The chart is not accessible to screen readers. Please switch to the table view to access the data.
Download
Source
Source
Release date
September 2017
More information
Region
Japan
Survey time period
fiscal year 2006 to 2015; the Japanese fiscal year starts on April 1 of the stated year and ends on March 31 of the following year
Supplementary notes
The data counted the areas which were subsided at 2 cm or more per year.
Area is not measured for all areas subject to.
The data in fiscal year 2011 includes ground subside cases that are considered to be affected by Great East Japan Earthquake.
Citation formats