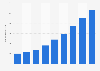
| Characteristic | Number of drones per 1,000 people |
|---|---|
| - | - |
| - | - |
| - | - |
| - | - |
| - | - |
The chart is not accessible to screen readers. Please switch to the table view to access the data.
Download
Source
More information
Region
Canada, United States
Survey time period
December 2013
Supplementary notes
* According to the source, values are calculated assuming 17 percent of the shipments are done by drone in 2016 and rising to 86 percent by 2020 and each drone can perform eight shipments per day with a delivery time including return time of 1.5 hours.
Citation formats