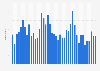
| Characteristic | 2011 | 2012 | 2013 | 2014 | 2015 | 2016 |
|---|---|---|---|---|---|---|
| - | - | - | - | - | - | - |
| - | - | - | - | - | - | - |
| - | - | - | - | - | - | - |
| - | - | - | - | - | - | - |
| - | - | - | - | - | - | - |
| - | - | - | - | - | - | - |
| - | - | - | - | - | - | - |
The chart is not accessible to screen readers. Please switch to the table view to access the data.
Download
Source
Source
Release date
December 2016
More information
Region
France
Survey time period
2011 to 2016
Supplementary notes
The Citeair Index indicates the quality of air based on the amount of pollutants carried in the air, including nitrogen dioxide, ozone, and particle matter (PM10). A lower score means cleaner air. The region displayed in this statistic is known as the Paris agglomeration.
The scale can be interpreted as follows:
- 0 - 25 is very low
- 25 - 50 is low
- 50 - 75 is medium
- 75 - >100 is high
- Any value higher than 100 is very high.
Citation formats