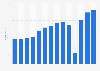
| Characteristic | Average daily rate in GBP |
|---|---|
| - | - |
| - | - |
| - | - |
| - | - |
| - | - |
| - | - |
| - | - |
| - | - |
| - | - |
| - | - |
| - | - |
| - | - |
| - | - |
| - | - |
The chart is not accessible to screen readers. Please switch to the table view to access the data.
Download
Source
Source
Release date
August 2024
More information
Region
United Kingdom
Survey time period
2011 to 2024
Special properties
financial years running for the 52 weeks ending in the last Thursday of April in the respective years
Supplementary notes
Average daily rate is calculated based on the total accommodation revenue divided by the total number of nights sold per unit.
Figures prior to 2024 were published in previous reports.聽
Citation formats