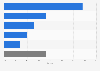
| Characteristic | Share of respondents |
|---|---|
| - | - |
| - | - |
| - | - |
| - | - |
| - | - |
| - | - |
| - | - |
| - | - |
| - | - |
| - | - |
| - | - |
| - | - |
| - | - |
| - | - |
| - | - |
| - | - |
| - | - |
| - | - |
| - | - |
| - | - |
| - | - |
| - | - |
The chart is not accessible to screen readers. Please switch to the table view to access the data.
Download
Source
Source
Release date
September 2016
More information
Region
Australia
Survey time period
2015
Number of respondents
202 enterprises
Special properties
among Australian businesses
Method of interview
Questionnaires and telephone interviews
Supplementary notes
Note: The source does not provide an exact date of survey.
According to the source, businesses were categorized into small (1 to 19 employees), medium (20 to 199 employees) and large (200 and more employees) companies.
For this survey question, respondents were allowed to select more than one choice.
Citation formats