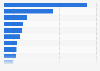
| Characteristic | Average time spent in the shower in minutes** |
|---|---|
| - | - |
| - | - |
| - | - |
| - | - |
| - | - |
| - | - |
| - | - |
| - | - |
| - | - |
The chart is not accessible to screen readers. Please switch to the table view to access the data.
Download
Source
Source
Release date
July 2017
More information
Region
Netherlands
Survey time period
1992 to 2016
Number of respondents
1,617 respondents
Method of interview
Questionnaire
Supplementary notes
The study consisted of three parts: an evaluation of the water using equipment at the participants' homes, a dairy research in which respondents filled in on a daily basis which equipment they used and for how long, and a questionnaire about drinking water usage.
** Numbers are measured in one-hundredth of a minute and not in seconds.
Citation formats