| Characteristic | Share of water drinkers |
|---|---|
| - | - |
| - | - |
| - | - |
| - | - |
The chart is not accessible to screen readers. Please switch to the table view to access the data.
Download
Source
Source
Release date
November 2017
More information
Region
Netherlands
Survey time period
May 12, 2017 to May 18, 2017
Number of respondents
509 respondents
Age group
18 years and older drinking water
Special properties
representative sample by gender, age and education level
Method of interview
Online survey
Supplementary notes
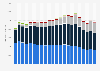
* This question was phrased by the source as follows: "Hoe vaak drink jij water?". Translation: How often do you drink water?
The source does not provide any information regarding percentage points exceeding 100 percent.
Citation formats