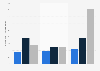
| Characteristic | Company value in billion U.S. dollars |
|---|---|
| - | - |
| - | - |
| - | - |
| - | - |
| - | - |
| - | - |
| - | - |
| - | - |
| - | - |
| - | - |
| - | - |
| - | - |
| - | - |
| - | - |
| - | - |
| - | - |
| - | - |
| - | - |
| - | - |
| - | - |
| - | - |
| - | - |
The chart is not accessible to screen readers. Please switch to the table view to access the data.
June 2016
Europe
April 2016
Valuations over two billion U.S. dollars included in the statistic.
From source: "We have included: Tech companies only, with a bias towards internet
and software (cleantech and biotech have been excluded). Companies falling into the following macro-sectors: eCommerce (e.g. sale of goods or services); Audience (e.g. monetisation through ads and lead generation); Software (e.g. licence of software); Gaming (including gambling); Fintech; Marketplaces; and Augmented Reality / Virtual
Reality (AR/VR). Companies headquartered in Europe, which were founded in 2000 or later. Companies with an equity valuation of $1bn+ in the public or private markets."
*New entry.