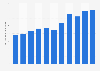
| Characteristic | Value added in billion euros |
|---|---|
| - | - |
| - | - |
| - | - |
| - | - |
| - | - |
The chart is not accessible to screen readers. Please switch to the table view to access the data.
June 2023
Belgium
2022
non-financial business economy only, excluding agriculture sector and non-market service sectors
Data are DIW Econ estimates for 2018, based on 2008-2016 Eurostat figures. The source adds the following information: "The data cover the 鈥榥on-financial business economy鈥�, which includes industry, construction, trade, and services (NACE Rev. 2 sections B to J, L, M and N), but not enterprises in agriculture, forestry and fisheries and the largely non-market service sectors such as education and health. The following size-class definitions are applied: micro firms (0-9 persons employed), small firms (10-49 persons employed), medium-sized firms (50-249 persons employed), and large firms (250+ persons employed)."