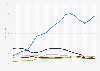
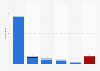
| Characteristic | Number of vehicles per thousand inhabitants |
|---|---|
| - | - |
| - | - |
| - | - |
| - | - |
| - | - |
| - | - |
| - | - |
| - | - |
| - | - |
| - | - |
| - | - |
The chart is not accessible to screen readers. Please switch to the table view to access the data.
Download
Source
Sources
In cooperation with
McKinsey & Company
Release date
2019
More information
Region
Worldwide
Survey time period
2011 to 2018
Supplementary notes
The statistic reflects data that was collected between 2011 to 2014:
China, Russia, Germany: 2018
U.S. and UK: 2017
France, Malaysia, Italy, Canada: 2013
Japan: 2012
Australia: 2011
Citation formats