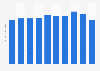
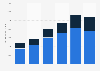
| Characteristic | Retail sales in million U.S. dollars |
|---|---|
| - | - |
| - | - |
| - | - |
| - | - |
| - | - |
| - | - |
| - | - |
| - | - |
| - | - |
The chart is not accessible to screen readers. Please switch to the table view to access the data.
Download
Source
Source
Release date
July 2022
More information
Region
Thailand
Survey time period
2013 to 2021
Supplementary notes
Note by source: Sales figures for 2018 and 2019 are expressed in US Constant 2019 Dollars to exclude the impact of foreign exchange and ensure comparability. Average annual exchange rates from the International Monetary Fund (IMF) have been used to convert data from local currency to US dollars.
Figures prior to 2021 come from previous reporting.
Citation formats