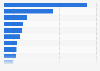
| Characteristic | Water withdrawls in thousand cubic meters |
|---|---|
| - | - |
| - | - |
| - | - |
| - | - |
| - | - |
| - | - |
| - | - |
The chart is not accessible to screen readers. Please switch to the table view to access the data.
Download
Source
Source
Release date
October 2021
More information
Region
Worldwide
Survey time period
2014 to 2020
Supplementary notes
According to the source, of the total volume of withdrawn water 28 percent is recycled water; 2 percent is ground water and the remainder is provided by local utilities, and all unconsumed water is returned to utility-owned wastewater treatment plants; 35 percent of water withdrawal occurs in high water stress areas (determined using WRI's Aqueduct tool). Not included in these figures are an additional 1.3 million cubic meters of water withdrawn for the construction of Facebook data centers.
Figures were rounded.
This statistic has been compiled from multiple reports.
Citation formats