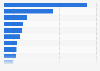
| Characteristic | Withdrawals in billion gallons per day |
|---|---|
| - | - |
| - | - |
| - | - |
| - | - |
| - | - |
| - | - |
| - | - |
| - | - |
| - | - |
| - | - |
The chart is not accessible to screen readers. Please switch to the table view to access the data.
Download
Source
Source
Release date
September 2018
More information
Region
United States
Survey time period
1950 to 2015
Supplementary notes
The figures were rounded. Geographic extent: 1950, 48 States and District of Columbia, and Hawaii; 1955, 48 States and District of Columbia; 1960 and 1975鈥�2015, 50 States and District of Columbia, Puerto Rico, and U.S. Virgin Islands; 1965鈥�1970, 50 States and District of Columbia, and Puerto Rico..
Citation formats