

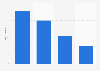


| Characteristic | 2015 | 2018 |
|---|---|---|
| - | - | - |
| - | - | - |
| - | - | - |
| - | - | - |
| - | - | - |
| - | - | - |
| - | - | - |
| - | - | - |
The chart is not accessible to screen readers. Please switch to the table view to access the data.
Download
Source
Source
Release date
November 2015
More information
Region
Worldwide
Survey time period
Q2 2015
Special properties
Supplementary notes
The key findings are based on an online survey of 101 senior IT executives representing more than 223 airports worldwide.
The airports participating in the survey represent 37% of the global traffic based on passenger traffic data from Airports Council International (ACI).
Citation formats



